Writer
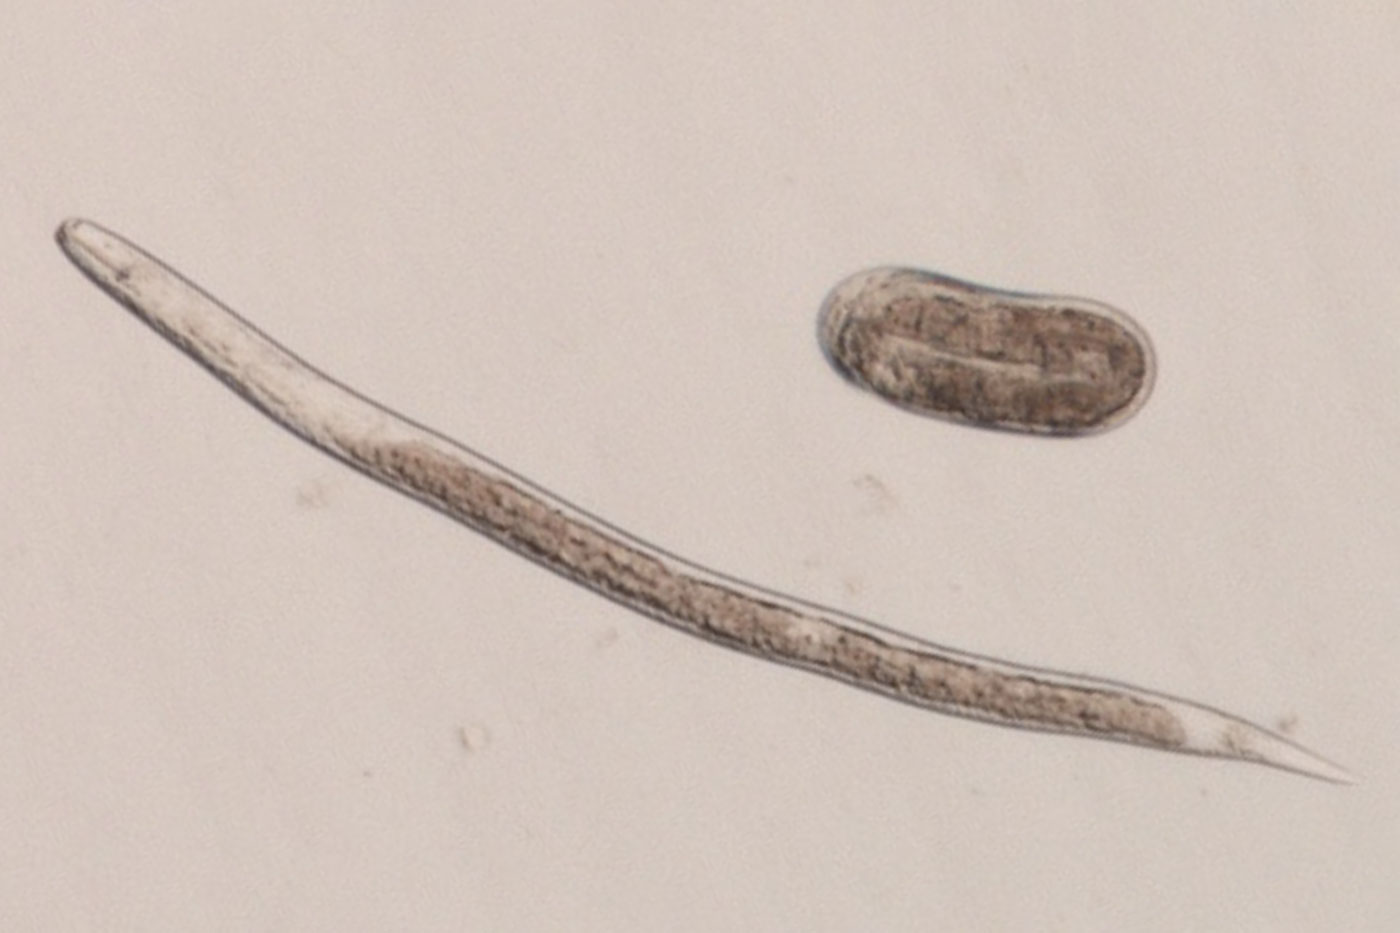
Mandy BishSoybean cyst nematode (SCN) can substantially reduce yield, but it is not always obvious when the nematodes (Figure 1) are present. Leonardo Da Vinci's quote: "We know more about the movement of celestial bodies than about the soil underfoot" seems somewhat appropriate when discussing SCN levels in the soil.

Research is ongoing to address some of the common questions regarding SCN control, such as:
- Effectiveness of different biological and chemical seed treatments across different environments.
- The extent to which SCN populations are adapting and able to reproduce on commercial soybean varieties. Most of these varieties contain the same source of SCN resistance.
- Identification of new resistance sources and breeding those into commercial soybean varieties.
Regardless of answers to these questions, if you have SCN present at high enough levels in your field now, you are likely losing soybean yield.
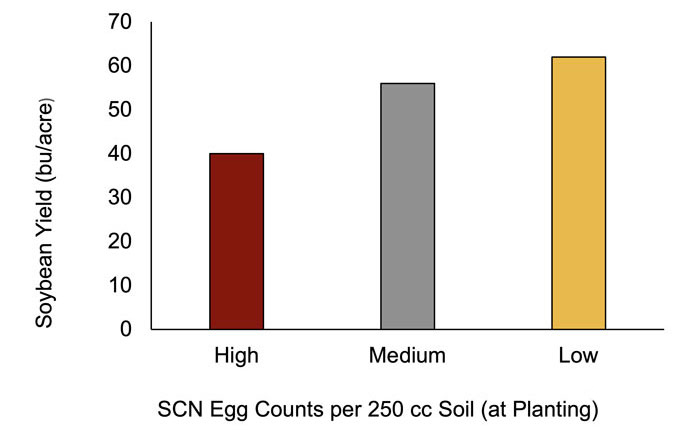
Figure 2 is a simplified graph to illustrate. The graph was generated using data collected in small plot research conducted on MU Agriculture Experiment Stations from 2019 to 2021.

Dr. Kaitlyn Bissonnette's team conducted egg counts at soybean planting and then returned to collect soybean yield from the same plots. The graph summarizes results from sites that had SCN present. The soybean variety used in these studies included the PI 88788 source of resistance.
Research plots that had high levels of SCN present corresponded to the lowest yield. Plots that had low or no SCN present corresponded to highest yields. (Eggs were found in all but 3 of the 300 plots analyzed.)
Knowledge is a good thing
It may be too late to change any plans for #plant2022, but it is not too late to gain knowledge about SCN in your fields. Sampling fields near the beginning and end of the growing season can give insight into whether you have a problem with SCN. And if so, to what extent and how is it spreading?
United Soybean Board (USB) and Missouri Soybean Merchandising Council (MSMC) are making it possible for Missouri producers to have 2 soil samples analyzed for free near planting and 2 soil samples in the fall. (Additional samples will be $25 each.) The sample submission form is available on the SCN Diagnostics website. Fields that have been in continuous soybean production or are prone to SDS are good places to start.
One of the 'best' features of this pest is that SCN spreads so slowly through the soil. However, this can make sampling a bit frustrating as there can be much variation within a few feet. Here are some resources on how to sample:
- Dr. Darcy Telenko provides a summary in this Purdue newsletter.
- The USB Soybean Cyst Nematode Coalition has produced a guide sheet: SCN Coalition Guide Sheet
For more information, please visit the SCN Coalition website or e-mail MU's SCN Diagnostics at scndiagnostics@missouri.edu.