Top 10 U.S. states for soybean production | Top 10 Missouri counties for soybean production | History of soybean in Missouri
Top 10 U.S. states for soybean production
| State | Rank (acres) | Production — # of bushels | # of acres | Yield — bushels/acre |
|---|---|---|---|---|
| Illinois | 1 | 698,750,000 | 10,750,000 | 65.0 |
| Iowa | 2 | 564,870,000 | 9,910,000 | 57.0 |
| Minnesota | 3 | 389,355,000 | 7,710,000 | 50.5 |
| Indiana | 4 | 346,320,000 | 5,920,000 | 58.5 |
| Nebraska | 5 | 333,350,000 | 5,650,000 | 59.0 |
| Ohio | 6 | 288,840,000 | 4,980,000 | 58.0 |
| Missouri | 7 | 261,000,000 | 5,800,000 | 45.0 |
| South Dakota | 8 | 256,680,000 | 5,580,000 | 46.0 |
| North Dakota | 9 | 243,530,000 | 6,860,000 | 35.5 |
| Kansas | 10 | 204,450,000 | 4,700,000 | 43.5 |
Source: U.S. Department of Agriculture/National Agricultural Statistics Service
Top 10 Missouri counties for soybean production
| Production | Acres | Yield | Portion of land | ||||
|---|---|---|---|---|---|---|---|
| County | Million bushels | County | Number | County | Bushels / acre | County | Percent |
| 1. New Madrid | 11.5 | 1. New Madrid | 209,500 | 1. Saline | 58.2 | 1. Mississippi | 66.4 |
| 2. Mississippi | 9.8 | 2. Stoddard | 189,600 | 2. Newton | 57.4 | 2. Pemiscot | 54.2 |
| 3. Stoddard | 9.0 | 3. Mississippi | 175,200 | 3. Lafayette | 56.9 | 3. New Madrid | 48.4 |
| 4. Pemiscot | 8.8 | 4. Pemiscot | 170,400 | 4. Mississippi | 56.1 | 4. Scott | 39.9 |
| 5. Audrain | 8.5 | 5. Audrain | 158,200 | 5. Clinton | 55.2 | 5. Atchison | 38.3 |
| 6. Saline | 8.5 | 6. Nodaway | 147,500 | 6. New Madrid | 54.7 | 6. Stoddard | 35.9 |
| 7. Nodaway | 7.5 | 7. Saline | 145,300 | 7. Audrain | 53.9 | 7. Audrain | 35.7 |
| 8. Atchison | 7.1 | 8. Atchison | 133,310 | 8. Osage | 53.9 | 8. Livingston | 34.3 |
| 9. Lafayette | 6.7 | 9. Carroll | 131,700 | 9. Atchison | 53.7 | 9. Dunklin | 34.2 |
| 10. Chariton | 6.2 | 10. Chariton | 130,300 | 10. Cooper | 53.4 | 10. Shelby | 31.5 |
Source: U.S. Department of Agriculture/National Agricultural Statistics Service
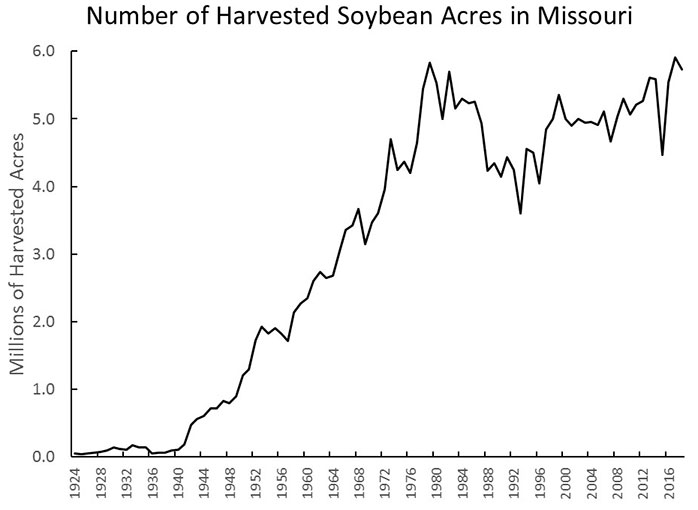
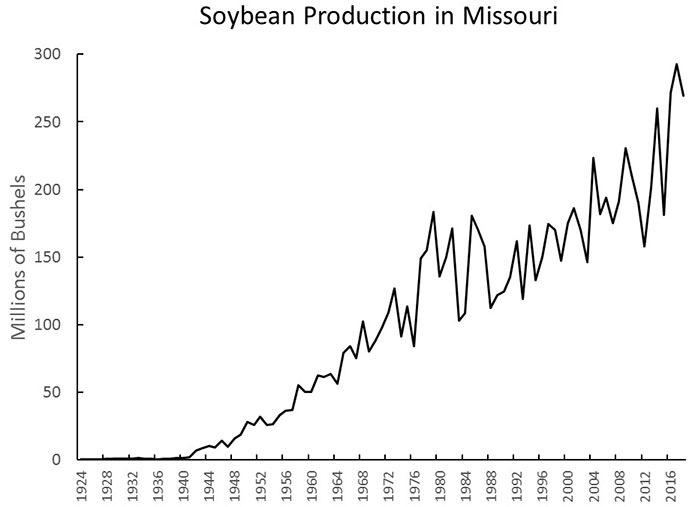
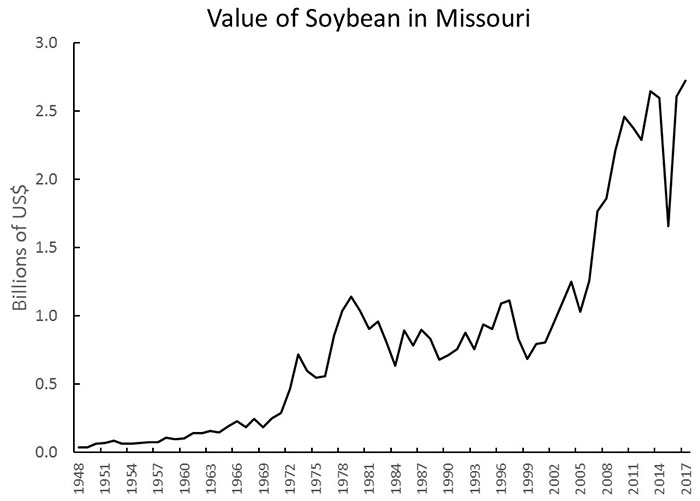
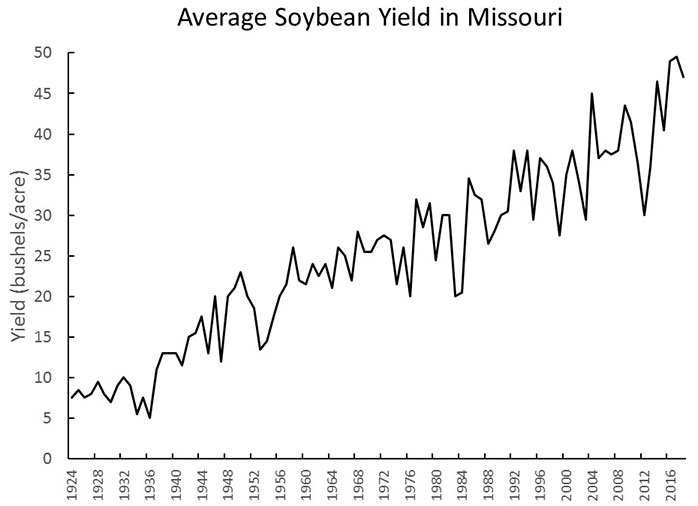
History of soybean in Missouri

Source: U.S. Department of Agriculture/National Agricultural Statistics Service

Source: U.S. Department of Agriculture/National Agricultural Statistics Service

Source: U.S. Department of Agriculture/National Agricultural Statistics Service

Source: U.S. Department of Agriculture/National Agricultural Statistics Service