Editor’s note
For more detail on the figures, download the figure data (XLSX).
Commodity basis provides a significant amount of information to agricultural producers and agribusinesses for making production, forward pricing, hedging and storage decisions. Basis tends to follow historical and seasonal patterns, and by understanding these patterns, a producer or agribusiness can make better management decisions and reduce risks involved in those decisions. Many persons believe that understanding basis patterns is the most fundamental means of evaluating marketing decisions. This guide provides an overview of commodity basis and explains the different ways it applies to crops and livestock.
Commodity basis defined
Commodity basis is the difference between a local cash price and the relevant futures contract price for a specific time period. For a specific commodity, basis is defined as follows:
Basis = Cash Price – Futures Price
where Cash Price is the cash price for a specific commodity at a given location and Futures Price is the relevant futures price for that commodity.
For example in Table 1, assume Jane raises corn and feeder cattle in Fayette, Missouri. On Oct. 4, the local elevator is buying corn for $4.20 per bushel and the local livestock auction is selling 7 to 8 hundredweight feeder cattle for $142.65 per hundredweight. On this same day, the closing price of the December corn futures at the Chicago Board of Trade is $4.45 per bushel and the closing price of the November feeder cattle futures price at the Chicago Mercantile Exchange is $140.80 per hundredweight. If Jane wants to know her basis, she would simply subtract the futures price from the cash price for each commodity.
Table 1. Basis calculation.
| Corn | Feeder cattle | |
|---|---|---|
| Local cash price | $4.20 | $142.65 |
| Less futures market price | $4.45 | $140.80 |
| Basis | -$0.25 | $1.85 |
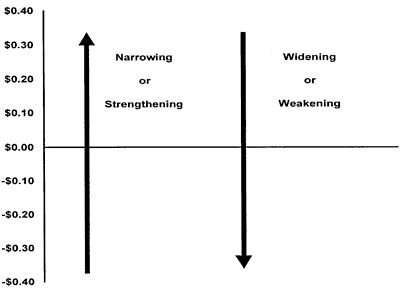
A negative value represents a cash price "under" the futures price, and a positive value represents a cash price "over" the futures price. A basis that becomes more positive or less negative over time is said to narrow or strengthen; one that becomes less positive or more negative is said to widen or weaken (Figure 1).
If the current basis is more positive than the expected (average) basis for the period, it is often referred to as "narrower" or "stronger" than normal. For example, if the current basis is -$0.10, when -$0.25 is "normal," the market is offering a strong or narrow basis. A basis of -$0.40 when -$0.25 is normal would be a weak or wide basis. When basis is stronger or narrower than normal, the market is providing a financial incentive to make cash sales. When basis is wide or weak, the market is discouraging cash sales and encouraging storage in the case of crops.
What basis tells us
For grain, basis is typically used to indicate current local demand. Thus, basis varies by location depending on the regional supply and demand (Figure 2). Weak basis (i.e., lower than normal for this time of year) indicates that the market does not want grain now but may want it later. Strong basis indicates the market wants the grain now. Basis is best used in deciding how to sell. Table 2 shows how a grain producer should respond to certain market situations. For instance, assume you are a corn producer who believes the corn price is high and basis is strong relative to historical patterns. What should you do? Sell in the cash market, because there is little opportunity to better the current market price through storage or by taking a futures position.
For livestock, basis refers to the difference between local supply and demand in a local location and supply and demand for the aggregate market. Basis contracts can be formulated for livestock just as they can for grains. Thus, understanding the basis can help farmers and agribusiness personnel evaluate forward contracting and hedging decisions. However, livestock commodities cannot be stored like crops.
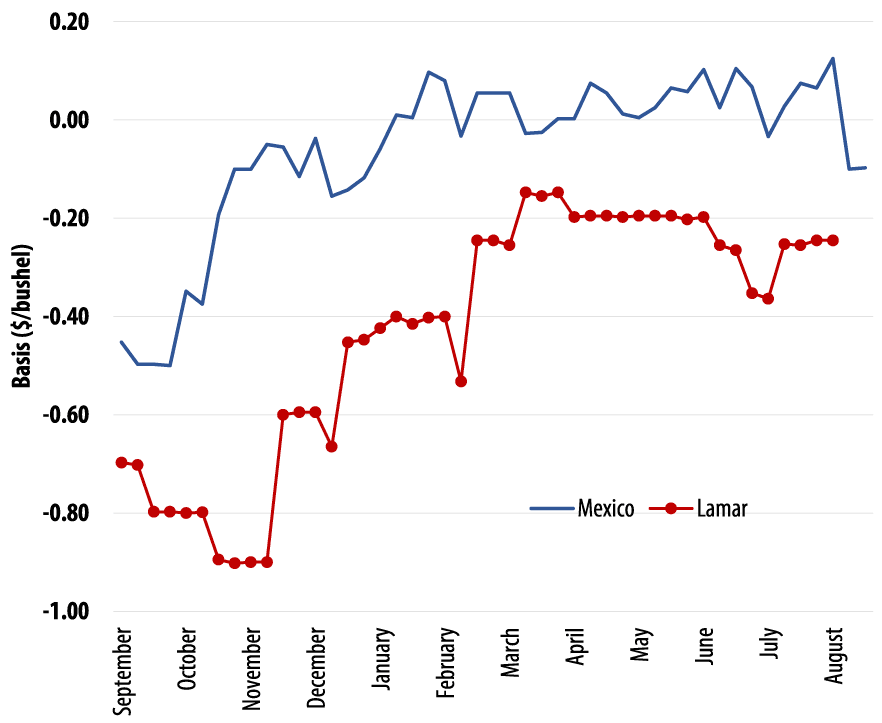
Table 2. How a crop producer should use basis in marketing strategies.
| High price | Low price | |
|---|---|---|
| Strong basis | Sell for cash | Sell for cash Re-own with futures or options (if a higher price is expected) |
| Weak basis | Hedge with futures Buy put option Delay cash sale | Store |
Hedging and basis
Basis is a crucial factor in hedging through the use of futures. Table 3 shows the gain or loss to a hedger when basis strengthens or weakens. Long hedgers, seeking to protect against increasing price, prefer that the basis weaken. That is, the hedgers pay less in the cash market relative to the futures market and may gain more from their position in the futures market.
Short hedgers, seeking to protect against decreasing price, gain from a strengthening basis. That is, the hedgers realize a cash price increase relative to the futures price and may gain more from their position taken in the futures market.
Table 3. Direction and impact of basis movement for short and long hedger.
| Long hedge | Short hedge | |
|---|---|---|
| If basis weakens (or widens) | Basis gain | Basis loss |
| If basis strengthens (or narrows) | Basis loss | Basis gain |
How basis patterns vary over time
Basis tends to vary over time and within a marketing year for grains, oilseed crops and livestock. As shown below, basis trends tend to persist over time and provide opportunities to those who understand these trends. Figures 3 through 7 provide examples of how basis patterns vary over time and within a marketing year.
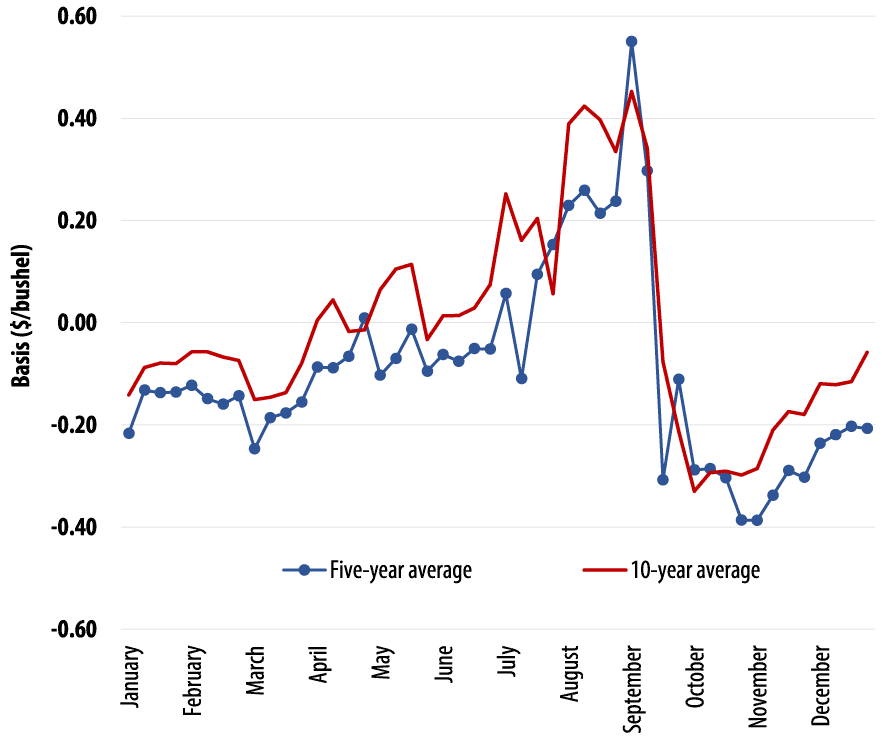
Figure 3 outlines 5- and 10-year average seasonal soybean basis trends for Kansas City, Missouri. Clearly, basis is strongest during the period from October to August (old crop) and weakens rapidly into the fall. Historically, soybean basis has strengthened considerably from mid-November until early January. Although there has been little change in soybean basis patterns over time — hence the resemblance in 5- and 10-year average basis patterns — the level of basis has changed, reflecting a general weakening of basis.
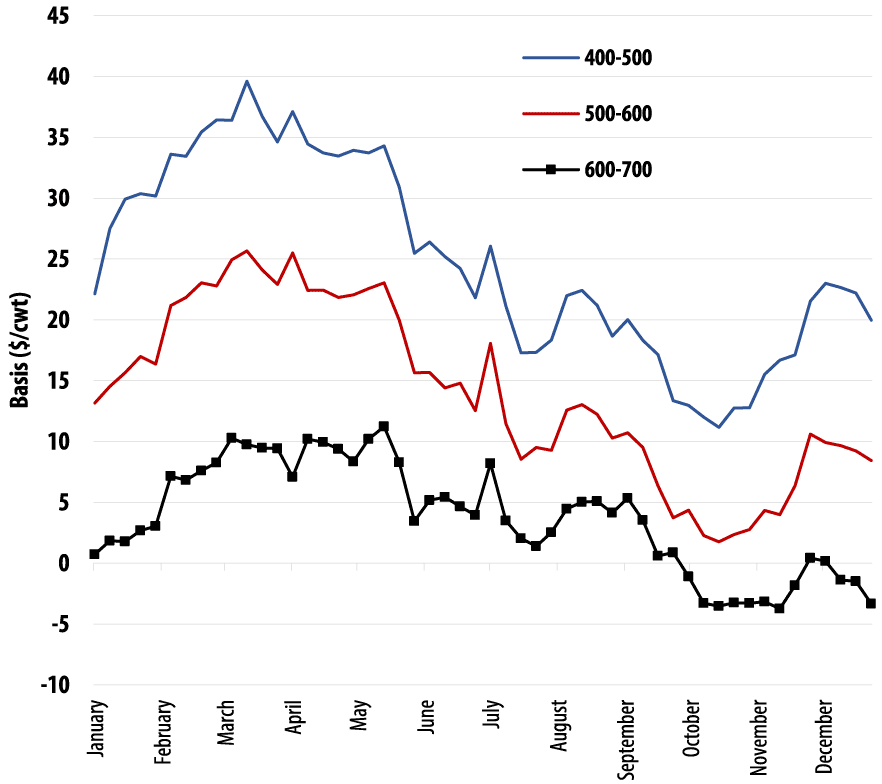
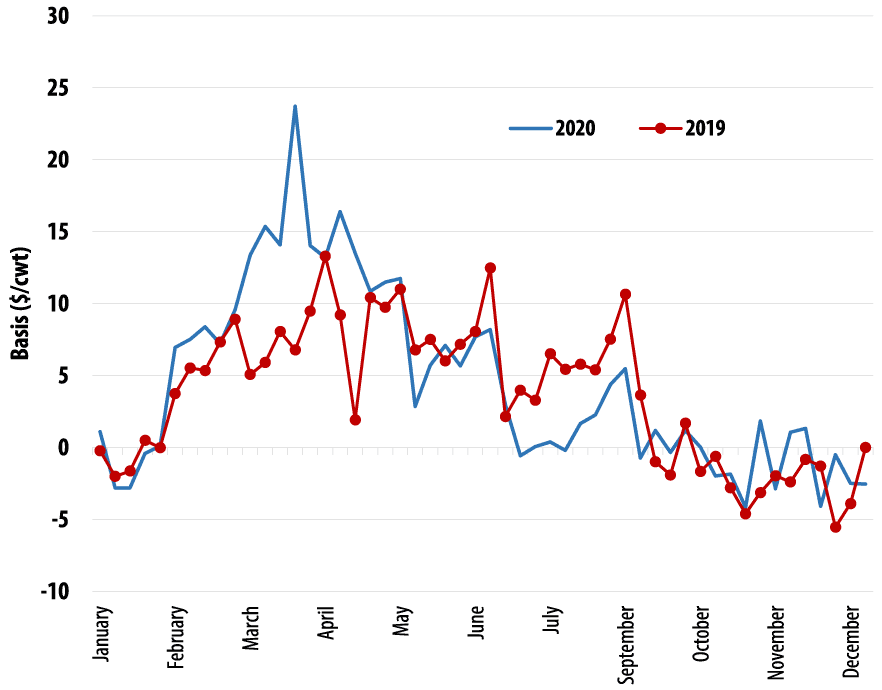
Figures 4 and 5, respectively, show the seasonal trends and difference in seasonal trends across years. Because feeder cattle are sold at different weights, basis is substantially different for alternative weight classes of feeder cattle, and seasonal patterns differ between weight classes (Figure 4).
Figure 5 describes the difference in seasonal basis between 2019 and 2020 for 600- to 700-pound feeder steers. Basis levels were unusually strong in March and early April of 2020 as feeder cattle futures fell more sharply in response to the COVID-19 outbreak than cash prices. Basis levels normalized by mid-2020.
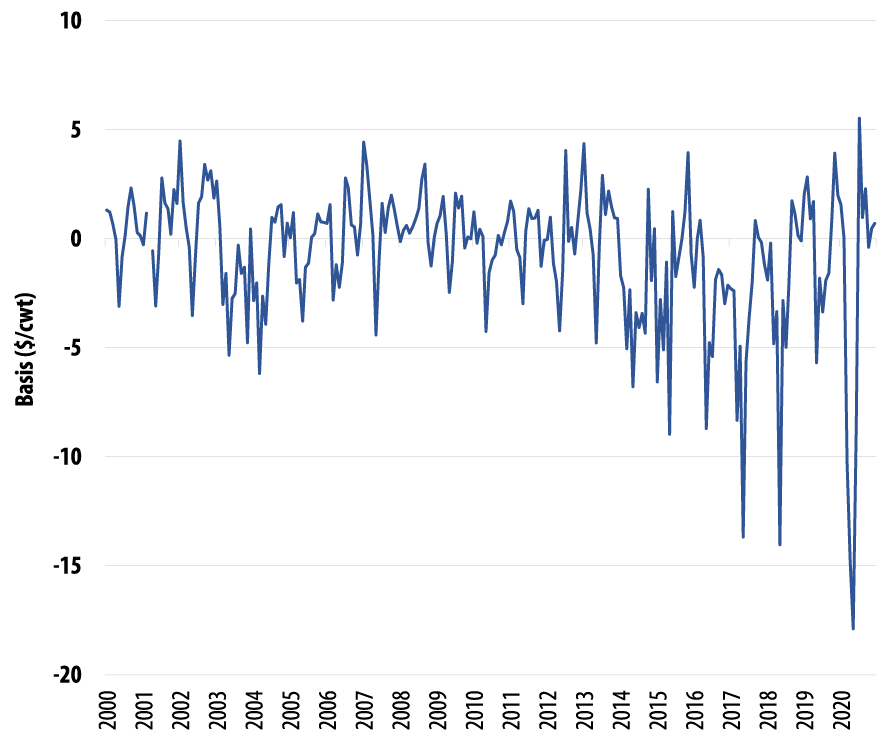
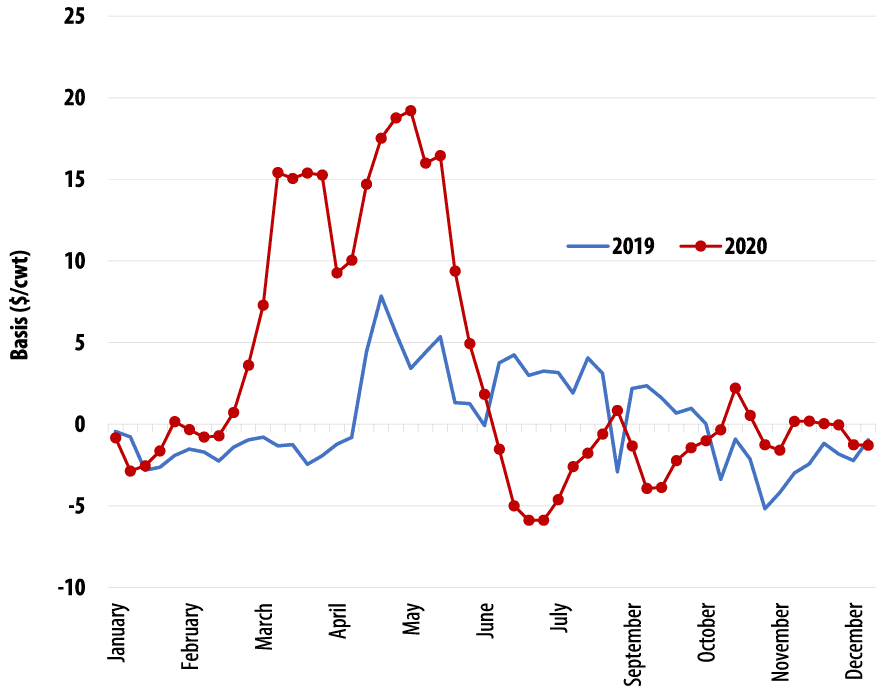
Figures 6 and 7, respectively, show the historical pattern and the difference in seasonal trends between years for live cattle. Figure 6 indicates that basis for Kansas fed steers from 2000 to 2014 varied by about $10 per hundredweight, ranging from -$5 per hundredweight to nearly $5 per hundredweight. In recent years, the range has increased to more than $20 per hundredweight. Figure 7 indicates that while basis patterns were similar between 2019 and 2020, the level of the basis value differed significantly at times, reflecting different local and aggregate supply-demand relationships across time.
Basis patterns will differ depending on where you market your commodity. Therefore, you may need to track local basis patterns over time and within the marketing year. Local Extension agricultural business specialists may be able to help you find this information.
Basis: A necessity for predicting a local cash price
Agriculture producers and agribusinesses face a diverse array of marketing and production alternatives. Each time a marketing or production decision is made, farmers or agribusinesses must estimate how the decision will affect their risk management plan. The most difficult of these decisions is determining what price to expect. No matter the time of year, this question always looms in the decision process. With the changes in the domestic farm program, producers now must decide which crop to plant given their known input costs and expected harvest-time prices. During this same time and the growing season, producers also must decide whether to forward price a portion of their crop. Finally, in the fall, producers must decide whether to store their crop, and cow/calf producers whether to retain ownership on a portion of their herd beyond weaning. Similarly, agribusinesses must determine price expectations to know what forward price to offer.
Commodity futures exchange markets provide a mechanism for price discovery on an aggregate level through arbitrage between multiple buyers and sellers. However, price discovery at a given location is not as clearly defined because local supply and demand relationships are not as well known. Despite these possible ambiguities, historical basis provides a linkage between these two markets. Therefore, a simple, low-cost and relatively good predictor of the local cash price is the futures contract [month] price of interest adjusted for a multiyear average basis for that time. An expected price, where E denotes an expectation, can be found using this formula:
E[cash price] = Futures Price + E[basis]
For example, assume that in December a cow/calf producer would like a forecast for April live cattle prices. The producer’s best expectation of that cash price might be the April live cattle futures price adjusted for an expected basis (say 5-year average basis for that area). If the April live cattle futures contract is trading for $119 per hundredweight in December, and the 5-year average basis is $2 per hundredweight, the expected price is $121 per hundredweight.