Water is an important factor that can affect crop yields. University of Missouri Extension developed an online application to help farmers produce higher crop yields by improving irrigation management. The Crop Water Use application can be run on an office computer or smartphone. To register, go to http://cropwater.org. This guide explains how to track soil moisture in fields for optimum yields and water conservation and gives information about how to use the application to that end.
Farmers with irrigation are usually able to harvest consistent yields, even in times of drought. Irrigation helps in periods of short-term crop water stress, which are common in Missouri summers in July or August. Farmers can prevent yield losses and conserve water resources with access to information on daily crop water use and by better understanding how much soil water can be stored for root uptake between rainfall and irrigation events in specific fields on their farms.
How does the application work?
The Crop Water Use program is designed to simplify calculations required for tracking soil moisture in fields. The application saves farmers time by automatically entering weather information for each field and making daily calculations used for irrigation planning.
In the New Field setup, farmers enter locations (latitude/longitude) and soil types for each field. This is a one-time job. Each growing season, farmers enter the crop and planting date for each field. The program predicts when fields need irrigation based on estimated soil water balance. The main information that the application needs from a farmer during the growing season is actual irrigation dates and rates.
The application estimates crop water use from weather data using an equation for calculating evaporation from soil and plants called evapotranspiration, or ET. The application also calculates daily soil water balances for each field. Reports include indexes to help farmers determine when to irrigate.
University of Missouri Extension automatically downloads data each day from a network of agricultural weather stations across Missouri. ET is calculated from temperature, humidity, wind and solar radiation. This application uses the standardized short crop Penman-Monteith Evapotranspiration equation, or ETo, which was developed by a committee of the American Society of Civil Engineers. ET is the amount of combined water lost from a reference crop, such as grass, and soil evaporation.
ETo is multiplied by a crop coefficient, which is specific for the crop and growth stage. The crop coefficients, with the exception of rice, are derived from United Nations Food and Agriculture Organization publication FAO-56. Beginning at planting, growth stages are predicted from heat units for corn, rice and cotton. Calendar days are used for soybean. This information is used to estimate daily crop water use, or ETc.
Irrigating fields on your farm
Irrigation is a management tool to protect against yield loss from crop water stress in years with low rainfall. In that regard, irrigation can be viewed as an insurance policy. The cost of installing irrigation depends on the water source and whether applications are made by flood, furrow or sprinkler. To be profitable, the value of higher crop yields from watering, averaged over several years, should exceed the cost of the irrigation. Irrigation applications when crops do not need them are a waste of water, energy and money. In a drought though, they can save a farm from financial ruin.
Most of the cost of irrigation comes from the equipment, which is a multiple-year investment. Wells, pumps, pipes, valves and sprinklers are fixed costs even in years when they are not used. Variable costs for irrigation include fuel costs, repairs and changes depending on how many inches of water are applied in a given growing season.
Field verification
Before deciding whether irrigation is necessary, check the soil dryness of a field with a shovel or soil probe and look at crop leaves for signs of water stress. Soil moisture sensors installed in fields are also useful for evaluating signs of water stress. The Crop Water Use application provides a model that estimates field soil water conditions and can be a helpful when making decisions about irrigation.
Weather
Watching El Nino and La Nina patterns can be helpful for long-term planning but less useful in day-to-day irrigation scheduling. Five-day rainfall predictions for a region are more useful, but isolated storms are common in the summer. Irrigation decisions can be difficult on days when the local weather forecast predicts an 80 percent or greater chance of rain for the region. It is generally best to assume your fields will get little to no rain unless radar shows a large, continuous band of rain moving toward your fields.
The two most common mistakes farmers make are waiting too late to start irrigation applications and not applying enough water to keep up with crop water use. The greatest crop water use occurs on days with bright sun, low humidity and strong winds. Crop growth and leaf canopy cover are also important. It is often difficult to adequately recharge soil water in the profile with later irrigations if a farmer fails to make a needed irrigation application. The economic savings of delaying or skipping an irrigation application are small compared to the potential yield loss from crop stress. Farmers should irrigate when the Crop Water Use application shows the soil water balance is at the trigger point rather than delay watering just because of a high probability of rainfall in the local forecast.
Daily crop water use from ET is mainly affected by sunlight intensity, humidity and wind. Using actual weather to estimate ET is more accurate than long-term historical averages. Sunlight, humidity and wind do not vary significantly across a region, so the nearest University of Missouri weather station is a useful resource. Year-to-year differences in ET for a calendar date are usually greater than location-to-location differences within a year. For example, ET differences were usually small in 2014 between the Columbia and Portageville weather stations for a specific summer day. But ET value differences were greater year after year at each location on the same date.
Evapotranspiration is more uniform over a region than rainfall. You can compare data from the University of Missouri weather stations. To access historical and real-time data from the extension weather stations in Missouri, go to http://agebb.missouri.edu/weather/stations. The application accesses the network of University of Missouri weather stations and automatically enters daily evapotranspiration estimates for crops. The application uses latitude and longitude of fields to input rainfall amounts from the National Weather Station rainfall grid. There are not enough University of Missouri weather stations to estimate rainfall in all farm fields, because isolated storms can occur on one field and miss another nearby.
Soil water balance
Daily soil water balance is the most important value for managing irrigation timing. When the soil profile is full, also known as the field capacity, the balance is zero. Field capacity is characterized as water that exists in the upper limit of available water. A soil is at field capacity moisture after excess water has drained from a large rain event or irrigation. As water is extracted, the balance becomes negative. Most of the graphics and tables, which will be discussed in greater detail in Navigating the application, are based on the soil water balance.
For each field, rainfall and irrigation are tallied as deposits, and crop water use and soil evaporation are tallied as withdrawals. The goal for farmers is to keep the soil water balance high enough throughout the growing season to prevent significant crop water stress. The soil water balance declines quickly during periods of high crop water use and low rainfall. As soils dry out, crop roots have more difficulty extracting water, which causes crop leaves to wilt and results in yield loss. If soil becomes too dry, plants die.
Irrigation trigger
Soil's available water holding capacity, crop rooting depth and allowable depletion are what you would use to determine a field's irrigation trigger point. Sandy soils hold less available water than loams and clays, so they would have quicker trigger points. To calculate your irrigation trigger, the application multiplies the readily available water in the root zone by the percent allowable depletion.
Rooting depth, a component of the trigger calculation, is one of the inputs in the field setup. Extension and USDA Natural Resource Conservation Service (NRCS) agents in your county can help you decide what rooting depth you should use. Typical rooting depths for many fields in the central United States are 18 to 24 inches. In fields with compacted layers or clay pans that limit root growth in the subsoil, assume shallower rooting depths (6 to 9 inches).
When setting up new fields in the application, you have a choice of entering soil texture or a five-digit mapping unit assigned to soil zones of fields by the NRCS. This information is used to estimate the available water-holding capacity of the soil in the field. The five-digit NRCS mapping unit offers more specific descriptions for different field situations than soil texture alone. Available water represents the upper and lower limits of plant available water is measured between filled capacity and permanent wilting point, or the soil moisture level at which crop plants die from water stress.
Allowable depletion is the final input needed to determine the irrigation trigger for a field. The best setting for allowable depletion is 50 percent for most crops, but use 30 percent for water stress-sensitive crops such as rice. It might help to think of different soils as car fuel tanks of different sizes. Tank size does not affect fuel efficiency, but it does determine how long you can go between fill-ups. As soil dries, the last 50 percent of the water available in soil is tightly bound to soil particles, so it's probably best to set the allowable depletion to trigger before the soil water "tank," to carry on the metaphor, goes past half empty.
Scheduling irrigation on fields
The Crop Water Use application is designed to allow users to monitor the soil water balance by two methods. Each way has it pros and cons for making management decisions. Farmers who like to plan several days in advance usually like Farm Summary. If you prefer to just take one day at a time, you might prefer Field Status.
Field Status
The Field Status button is on the main menu of the application. Farmers can scroll between fields each day to determine which needs to be irrigated. Fields are sorted driest to wettest based on their current estimated soil water balances. Use an index finger to swipe right to left across a smartphone screen to advance to the next field. To navigate to other fields on a computer screen, move the cursor close to center of the page. Then click and hold either button of the mouse while moving right to left to advance or left to right to go back.
Each field has two graphs in the field status display designed to resemble an electronic fuel gauge. The first shows the relative soil water balance to field capacity (wet) and permanent wilting point (dry) with the irrigation trigger in the center. It stops when the soil water balance declines past the trigger point in the center. Figures 1 through 3 offer examples of different soil water conditions. In the first and second figures, irrigation is not needed. In the third figure, a farmer should check the soil and crops in the field to determine whether irrigation is needed.
As a field gets drier, the graph will move toward the middle, which is the trigger point. The goal is to irrigate before a field reaches the trigger point in the center.
Also in Field Status, located below the bar graph, a line graph tracks how the soil water balance has done over the past four weeks relative to the irrigation trigger. This is a good way to see how well you have been keeping up with irrigation over the past month. If a field's soil water balance is consistently below the trigger line, you might need to irrigate more frequently.
 Figure 1
Soil water is near field capacity.
 Figure 2
Field is drying, but irrigation might not be needed.
 Figure 3
Check soil and crops to verify irrigation is needed.
Farm Summary
This is the second monitoring option in the Crop Water Use application that can help a farmer make plans in their fields for the next week, assuming no rainfall occurs. It can help you plan ahead for labor needs and help anticipate future irrigation needs that might interfere with planned activities.
The Soil Dryness Index in Farm Summary is derived from the soil water balance and the irrigation trigger and can simplify irrigation management to save farmers time. For growers with 100 or more fields, keeping up with each field's irrigation trigger value can be difficult. For example, two fields of a crop planted on the same day can differ even when soil water balances are the same because the soils are not the same. A field with silt loam soil might last one or two days longer without water stress than a field with sandy loam soil, which might need to be irrigated sooner.
To make the process easier to interpret, a dryness index with four levels based on a critical soil water balance for each field is calculated from rooting depth, available water holding capacity and allowable depletion. Table 1 is an example from research fields irrigated at University of Missouri. Field 4 Pivot E and Lee Field 12-1a needed irrigation that day. The others could wait until later in the week. A warning is displayed on the Farm Summary screen based on the soil water balance trigger for each field. If a field shows an OK dryness index, that means the balance is greater than 70 percent of the critical level. One, two or three asterisks were shown when the balance exceeds 70, 80 or 90 percent of the critical level, respectively. The farm summary displays XXX when the balance exceeds the critical level and irrigation is needed.
The dryness indexes for each field assumed historical evapotranspiration, or ET, for the projected days and no rainfall will occur in the next week. Fields can be printed out to distribute to farm workers.
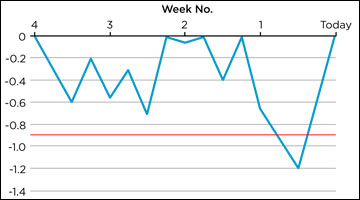 Figure 4
Example graph of soil water balance over a four-week period, with an irrigation trigger point of -0.90 inch.
Reports
Farmers using the Crop Water Use application might be eligible to receive federal funds from Environmental Quality Incentives Program (EQIP). To promote water conservation and reduce nutrient runoff in streams, the EQIP pays farmers in designated watersheds to use this application. Starting in 2015, the Crop Water Use application met the criteria for the Missouri 2015 General Conservation Stewardship Program, Enhancement Activity NRCS Code WQT07 (Regional weather networks for irrigation scheduling). The application has a reporting option that allows users to print season-long results for each field, which can be used as documentation to receive EQIP payments at the end of the year from the NRCS. This report could also be used to calculate the amount of water pumped per field or well for a field.
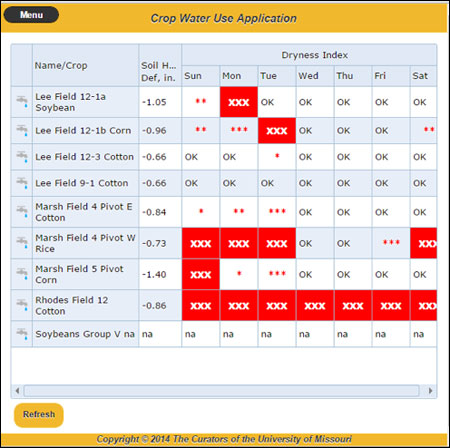 Figure 5
An example of a daily farm summary report from irrigated fields managed by the Fisher Delta Research Center Cropping Systems Project.
Navigating the application
To register for the application, go to http://cropwater.org (Figure 6). Read the Terms of Use. If you approve, click I agree. Enter your email address, username and password in the appropriate text boxes.
On the next screen, you have the option to either launch the application and bookmark the link or request the URL by email.
If you request an email link, you will receive an email containing a URL with a unique combination of 32 numbers and letters to link to your account. Only share your unique URL with people you trust. You can copy and paste the URL to your computer and mobile phone to save time not having to type in a password every day to check your fields.
The Crop Water Use application requires daily weather data from the Missouri weather station Mesonet to function. Currently, the program only works when you have internet access by Wi-Fi or a cellular data connection.
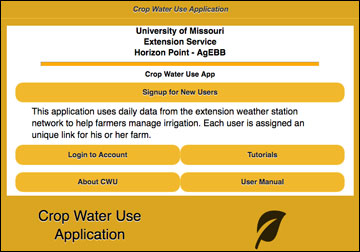 Figure 6
Screen for new users and login for existing accounts.
Main screen
Using your unique URL, go to your Crop Water Use application account. The first screen that will appear is the main menu screen (Figure 7). This is the starting place to add new fields, enter soil and crop information, monitor daily soil moisture, log rainfall and irrigation amounts, and request field reports.
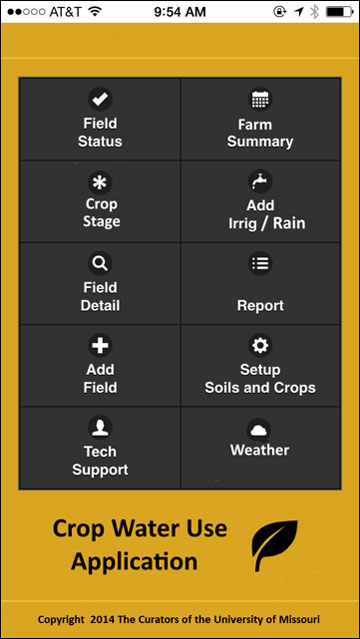 Figure 7
The main menu screen in the mobile app.
Field Setup
Click Add Field in the fourth row of the main menu screen. On the next screen, enter a field name and decimal degrees for north latitude and west longitude that are both positive numbers (e.g., Lat: 36.4151365N, Long: 89.7010119W). If you enter west longitude as a negative number, the program will correct it without error. You will have the option to find your field using Google Maps.
Be sure you have entered the correct GPS location for the field before clicking Submit. The location cannot be changed after you submit it, but it is easy to delete and re-enter a field. Although the latitude and longitude are locked in, soil texture for a field can be changed later if needed.
Enter the dominant five-digit NRCS soil series code for the field or select the dominant soil texture for the field. This is used to estimate available soil water holding capacity. For more information about soils, go to http://websoilsurvey.sc.egov.usda.gov/App/HomePage.htm.
Click Submit and then Back to main menu. The next step is setting up crop information. In the main menu, click Setup Soils and Crops. Then scroll to the field name and click the Choose Crops button under Crops in the column on the right.
Select the crop planted in the field and its planting date, which is set by default to December 31 (Figure 8). If you don't know the crop and planting date yet, do not guess. Skip these boxes and come back later. You can enter other inputs on this page even if you don't know the crop and planting date. Click Submit to save the information.
The next box on the page is Soil water deficit on planting date. Unless spring rainfall has been unusually low, leave this at the default value of zero, which is the field capacity, for initial soil moisture. This value is based on the entire rooting zone not just the soil surface. To check the soil moisture, use a soil probe or shovel and dig in the rooting zone. For coarse-textured soils at field capacity moisture, you should be able to roll a weak soil ball in your hand. For finer-textured soils, the ball will be firmer and should leave wet outlines of the soil on your hand. Learn more at http://www.nrcs.usda.gov/wps/portal/nrcs/detail/mt/about/?cid=nrcs144p2_056492.
You can probably fill in the rest of the inputs on this page. The effective root depth for most crops in Missouri is 18 to 24 inches. If the soil has a restrictive layer due to compaction, enter a shallower depth. The rooting depth can be modified at a later time if need be. Select the irrigation method and default rate of water application. Leave the allowable field water depletion at the default of 50 percent unless you want to be more liberal with your irrigation applications.
Click Yes on NWS Rainfall if you want the program to automatically enter estimated rainfall amounts based on GPS locations of the field, or click No to never use NWS rainfall estimates. If you click yes, you will also have the option during the season to substitute your rain gauge measurements for individual rainfall events or completely turn this feature off. Repeat these setup steps for other fields until you have entered all of your fields.
It is important to note that Field Status and Field Summary will show fields are inactive while weather files are being configured in the application. Please be patient. The application might take as long as a day to fully activate new fields after you have completed the setup process.
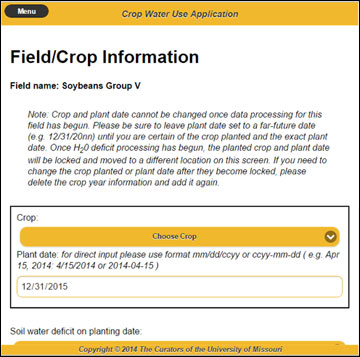 Figure 8
Page for entering field and crop information.
Monitor daily soil water in fields
In the main menu, click Field Status or Farm Summary to check daily water status in each field. Field Status shows estimates of the soil water balance for each field for the current day, and Farm Summary shows projected dryness indexes for all of your fields for today and the next week, assuming no rainfall occurs (Figure 9).
To navigate between fields in Field Status on a smartphone, swipe your finger right to left or left to right across the bottom of the screen. To navigate to other fields on a computer screen, move the cursor close to center of the page. Then click and hold either button of the mouse while moving right to left to advance or left to right to go back. As the season progresses, your fields will be sorted each day from driest to wettest soils.
The Farm Summary page shows today's soil water deficit and dryness index and for the next week. The Dryness Index warns you when the soil water deficit is coming close to the management allowed depletion (MAD) level of the field, which is the recommended trigger for irrigation. The symbols (*,**,*** and XXX) represent 70, 80, 90 and 100 percent of MAD, respectively (Figure 10).
Soils have different water storage capacities, so no single soil water deficit value is acceptable across all soils. For example, crops growing on sandy soil experience water stress faster than crops on silt loam soil. The factors used for calculating MAD are soil texture, crop rooting depth and allowable depletion. Soil texture is used to estimate available water holding capacity (AWHC). Irrigation applications are usually triggered faster in the application on fields with coarse-textured soils than medium- and fine-textured soils because coarse textured soils often have lower AWHC. The formula in the application for calculating MAD is AWHC × root depth × percent allowable depletion.
More details about water credits and debits can be found on the Field Detail page. You can find this screen from the main menu or clicking on a row in the Farm Summary table. This screen shows the daily values for crop evapotranspiration, inches of rainfall and soil water deficit for the last week. To view more, click All Days at the bottom of the page. The second row of inputs is for entering rainfall and irrigation amounts after the fields have been setup.
When soil water deficit values equal 70 percent of the MAD level, the dryness index column will display a single red asterisk. Without rain or irrigation, more asterisks will appear in the following days. Avoid letting the index reach 100 percent of the irrigation trigger, which is represented by a XXX in the dryness index. Once a field's soil becomes dry, crop yield is lost.
If the dryness index in the application does not match soil moisture sensors or visual indicators of crop water stress, fine-tune the field setup by adjusting the rooting depth or allowed depletion percentage.
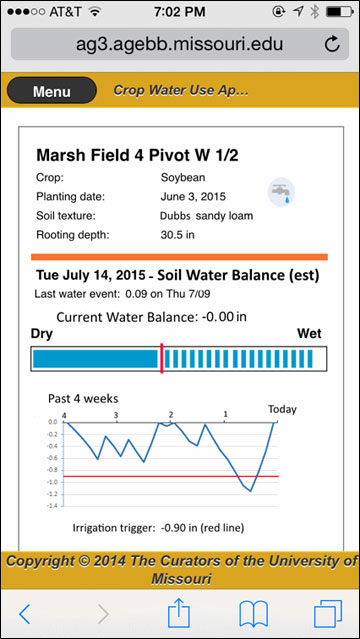 Figure 9
Field Status screen for checking daily soil water deficits in individual fields.
 Figure 10
Main menu screen for checking soil water dryness indexes for the next week.
Enter rainfall and irrigation amounts
Two options are available for entering rainfall and irrigation events. Click on the water spigot symbol in a field row to navigate to the Add/Edit Precipitation and Irrigation page (Figure 11). If you selected Yes for NWS rainfall in setup, the third column will be NWS Precip. To override NWS for a specific day, enter your observed value in the column labeled Field Precip. The rainfall amounts that are underlined indicate which value the application is using for that day. The NWS amount will still be displayed, but it will not be used by the application.
To enter rainfall amounts, click on a cell in the Field Precip column corresponding to the date that field received precipitation. Likewise for irrigation, click on the Field Irrig column to enter amounts of irrigation applied. The default irrigation rate entered during setup will appear on a new screen, but it can be modified before clicking Submit, if necessary (Figure 12). When you submit changes with Add/Edit Precipitation and Irrigation for one field, to save time, you can also copy those changes to other fields on your farm. A list of all your other fields will be displayed. When other fields receive the same amount of irrigation, click the check boxes beside their names at the bottom of the page.
Unfortunately, the 24-hour period for rainfall at the National Weather Service is not midnight to midnight. It is mid-morning to mid-morning, so late-afternoon rainfall will not be posted in the application until 6 a.m. the next day. If you have an observed measurement of rainfall, such as from a rain gauge, enter it rather than waiting for an NWS update. If the NWS shows a rainfall amount but none actually occurred, enter 0 in the Field Precip column. If other fields on the farm also received the same amount of rainfall, click the check boxes beside their names at the bottom of the page.
To access a report for printing, go to Report in the main menu (Figure 13). Select the field to print and click Print.
The Crop Stage page allows you track the growing degree days based on maximum and minimum daily temperatures for crops in your fields. For some crops, such as cotton, scientists at the University of Missouri Fisher Delta Research Center are developing recommendations relative to the current growth stage. To access the recommendation, click the black box in the last column (Figure 14).
The Weather page provides links to real-time weather stations in your region. The weather is updated several times each hour and can be useful for helping make decisions about your farm, such as whether it is too windy to spray.
The Tech Support page shows contact information for staff at the University of Missouri who can help you with irrigation management.
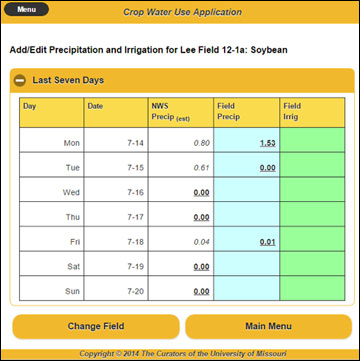 Figure 11
Edit precipitation and irrigation amounts for a field.
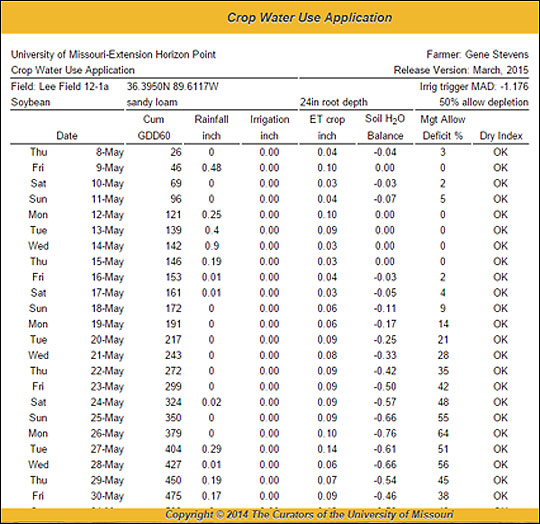 Figure 12
To save time, check boxes next to other fields irrigated at the same rate.
 Figure 13
Example field reports showing daily rainfall, irrigations and crop evapotranspiration.
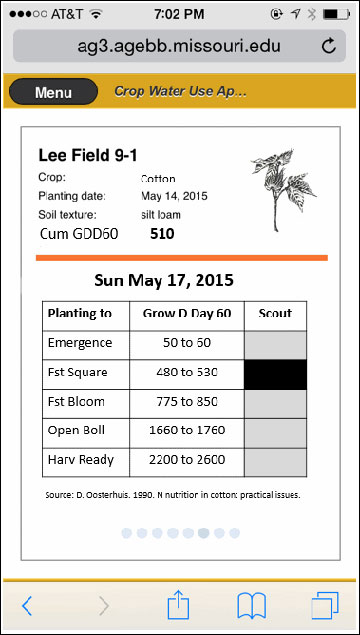 Figure 14
The Crop Stage function shows the predicted growth stage for plants in a field.