Missouri’s food, agriculture and forestry industries are an important part of the state’s economy, and employ workers in every county. Analyzing available Labor Market Information allows us to better understand the employment patterns of the 98 NAICS-based industries that comprise food, agriculture and forestry in Missouri.1 These data show several key employment trends, including:
- Food, agriculture and forestry employers are located throughout the state — urban counties contain the most jobs, but employment is most concentrated in rural counties.
- Total wage and salary employment has remained relatively steady over the past two decades.
- Food, agriculture and forestry industries employ workers from a broad set of occupational groups.
- The majority of jobs require training and experience, more so than post-secondary education.
This brief describes these trends in greater detail. Understanding this information, is a critical first step toward crafting strategies that help food, agriculture and forestry employers better meet their workforce needs.
Food, agriculture and forestry jobs are found throughout the state
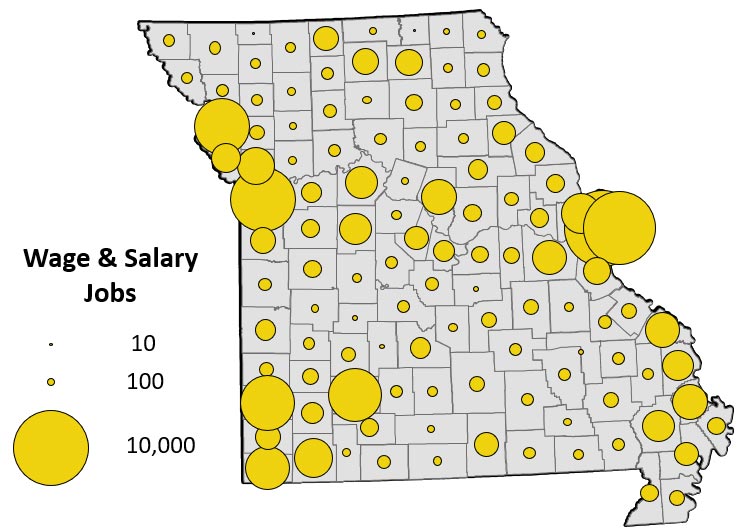
In 2019, there were over 107,000 wage and salary food, agriculture and forestry jobs across Missouri.2 Figure 1 shows the majority of these jobs (65%) are in urban counties where 75% of the state’s population lives. St. Louis City and the counties of St. Louis, Jackson, Buchanan and Jasper each contain over 5,000 jobs. Relatively large numbers of food, agriculture and forestry-related jobs are also found in rural Barry, McDonald, and Perry counties (each with 2,000 jobs or more).
 Figure 1. Wage and salary jobs in food, agriculture and forestry. (Source: Economic Modeling Specialists, Int’l, 2019.4)
Although urban counties account for the majority of these jobs, these activities remain vital to the state’s rural economies. Figure 2 shows the relative concentration of food, agriculture and forestry jobs within each county. These figures reflect each county’s reliance on these jobs, relative to the nation.3 For instance, counties like Sullivan and McDonald have more than 3.4 times as many food, agriculture and forestry jobs as the average U.S. county, as large processors like Smithfield in Milan and Tyson in Noel represent a significant share of those counties’ respective employment. Consequently, any employment changes in those plants can have large impacts on their local economies.
 Figure 2. Relative concentration of wage and salary jobs in food, agriculture and forestry. (Source: Economic Modeling Specialists, Int’l, 2019.4)
Employment varies by industry segment, but total jobs have remained stable
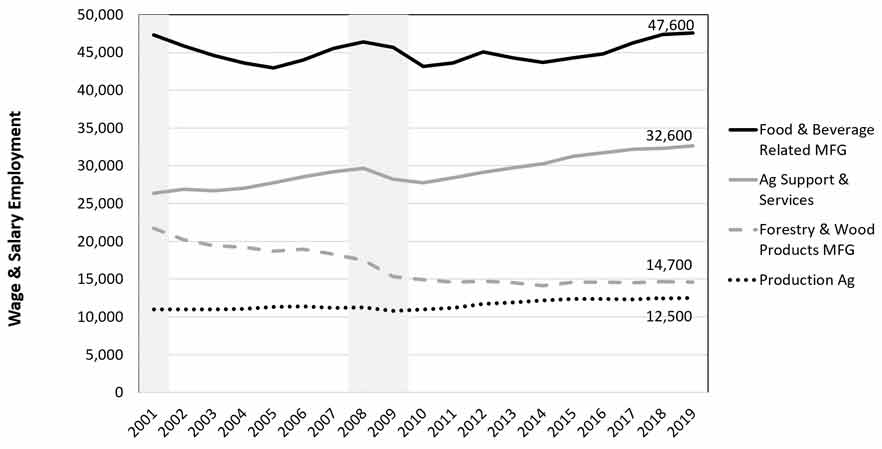
Total food, agriculture and forestry wage and salary employment in 2019 (107,350) was only slightly higher than it was in 2001 (106,500), due in part to net job loss in forestry and wood products manufacturing. Recently, growth had begun to increase. Figure 3 shows these industries added approximately 7,000 net new wage and salary jobs between 2014 and 2019. This represents a compound annual growth rate of 1.4%, a rate slightly faster than growth rate for all Missouri wage and salary jobs (1.2%). Employment in food and beverage-related manufacturing industries accounted for nearly half of all food, agriculture and forestry jobs. Another 31% were in agricultural support and services, 14% in forestry and wood product manufacturing, and 12% in crop, livestock, and other production agriculture industries.4
 Figure 3. Employment change in Missouri’s food, agriculture and forestry industries. (Source: Economic Modeling Specialists, Int’l, 2019. 4)
Production occupations represent more than one in three jobs in food, agriculture and forestry
Given the diversity of activities among food, agriculture and forestry, employers need workers to undertake a wide array of tasks. Table 1 shows that employers need workers to fill jobs in a broad set of occupational groups, with production occupations — most commonly found in manufacturing — accounting for more than one-third (36%) of all food, agriculture and forestry occupations.5 This is due in large part to the large employment contributions of the state’s food manufacturers. Transportation and material moving occupations contribute another 12% of food, agriculture and forestry jobs, as employers across all four segments need truck drivers. Farming, fishing and forestry occupations (e.g., agricultural equipment operators, loggers) represent 8% of all occupations in the defined set of industries.
Table 1. Missouri agriculture, food and forestry occupations, 2019.
| Occupation Group | Percent |
|---|---|
| Production | 35.8% |
| Transportation & Material Moving | 11.7% |
| Bldg & Grounds Clean & Maintenance | 11.5% |
| Farming, Fishing, & Forestry | 8.3% |
| Office & Administrative Support | 8.1% |
| Installation, Maintenance, & Repair | 5.1% |
| Healthcare Practitioners & Support | 4.8% |
| Management | 4.5% |
| Sales & Related | 3.9% |
| All Others | 6.3% |
| Source: Economic Modeling Specialists, Int’l, 2019.4 | |
Most food, agriculture and forestry jobs require training and experience, more than post-secondary education
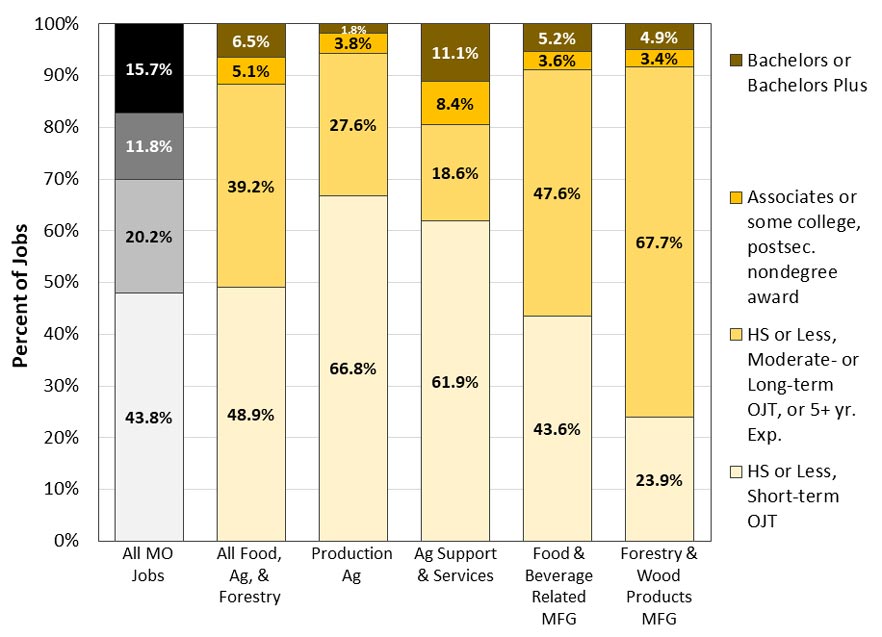
Only 12% of jobs in food, agriculture and forestry require some kind of post-secondary degree or certification, ranging from tractor-trailer truck drivers that require a Commercial Driver’s License (CDL) to veterinarians. These occupations tend to have higher median wages. However, due to the nature of the work, food, agriculture and forestry activities often need workers with relatively more extensive on-the-job training (OJT) and experience. Figure 4 shows that nearly 40% of food, agriculture and forestry jobs are in occupations which typically require moderate (one month to one year) or long-term (more than one year) OJT or five years of experience; this figure is double the share of jobs within the overall Missouri workforce. Given that many occupations within Missouri’s food, agriculture and forestry industries do not typically require post-secondary education, they often pay lower wages relative to other industries.
 Figure 4. Share of wage and salary jobs by typical entry-level education, 2019. (Source: Economic Modeling Specilaists, Int’l, 2019.4)
The nature of this demand varies between the different industry segments. For instance, production agriculture and agricultural support and services are more likely to employ workers with less education and training, due in part to the large proportion of jobs in farm laborer and landscaping and grounds keeping occupations. By contrast, many manufacturers often have greater need for workers with more experience and OJT. As a result, more “middle skill” occupations (e.g., machine operators, maintenance) are often found in food and wood products manufacturing. Given these trends, preparing people to work in food, agriculture and forestry is more of a training challenge than an education challenge.
Key takeaways
Food, agriculture and forestry industries are foundational to Missouri’s economy. They create employment opportunities — in both urban and rural areas — for many Missourians, and particularly for those that do not possess post-secondary education. Many of these jobs require specialized training (e.g., veterinarians, agricultural equipment technicians), but others such as truck drivers and laborers are in-demand throughout the economy. Meeting the demand for these jobs therefore requires:
- Growing interest — among both new and incumbent workers — in the job opportunities available in food, agriculture and forestry,
- Increasing knowledge of relevant training and education programs among both employers and workers, and
- Better understanding among employers about how to effectively compete with other industries such as construction or distribution for similar kinds of workers (e.g. truck drivers).
For more information
This brief was drawn from a longer, more detailed workforce needs assessment. More information about the challenges facing Missouri’s food, agriculture and forestry industries can be found in the full report: Workforce Needs Assessment of Missouri’s Food, Agriculture and Forestry Industries (PDF).
Endnotes
- The industries included in the study are based on the North American Industry Classification System (NAICS). NAICS provides a way to classify business establishments for the purpose of data collection and analysis. They describe an establishment’s primary line of business (e.g., wood pallet and container manufacturing, breweries, veterinary services). A list of the included industries can be accessed in the full report (PDF).
- Unless noted otherwise, the analysis uses Economic Modeling Specialists International (EMSI). The EMSI data combine U.S. Bureau of Labor Statistics employment payroll data from its Quarterly Census of Employment and Wages. EMSI then estimates data where BLS privacy standards do not allow it to disclose publicly. These estimates allow us to get greater industry and geographic data. Moreover, EMSI provides a number of labor saving tools such as producing data for the staffing pattern analysis.
- We measure relative concentration in Figure 2 using location quotients (LQ), which measure the percentage of a state or region’s food, agriculture and forestry employment, compared to the national food, agriculture and forestry employment share. An LQ greater than 1.0 means that the region has a higher share of jobs in food, agriculture and forestry than the overall national economy. Furthermore, if the industry’s LQ is growing over time, then industry employment is becoming more concentrated in the region; which can suggest an improvement in the region’s relative competitiveness.
- We recognize that there are significant numbers of people involved in production agriculture that do not hold wage and salary jobs. For instance, data from the U.S. Bureau of Economic Analysis, shows that there were approximately 86,500 farm proprietorships in the state of Missouri in 2018. Nevertheless, this report focuses on the occupations within firms which have employees.
- Whereas industry data (i.e., NAICS) identify an establishment’s primary line of business (e.g., animal production, farm management services, poultry processing), occupational categories are used to collect and analyze data about what workers actually do (e.g., farmers, ranchers, and other agricultural managers; heavy and tractor-trailer truck drivers; meat, poultry, and fish cutters and trimmers, etc.).