Sire selection is one of the most important decisions cow/calf producers make. If it is effective, sire selection will account for nearly 90 percent of the genetic improvement in a herd. In herds that produce their own replacement females, 87.5 percent of the heifer's genetic makeup comes from the last three bulls used in the pedigree.
Sire selection is more accurate today than ever before. Breed associations have developed computer programs that use performance records on a calf's relatives in addition to its own record in calculating estimated breeding values (EBVs). Traits evaluated include birth, weaning and yearling weights and maternal breeding value for daughters' calving ease and weaning weight. Using these estimated breeding values in a selection program has improved the accuracy of identifying superior and inferior animals within a producer's herd.
The development of sire summaries has been a big advancement for the beef cattle industry. Sire summaries have given breeders an opportunity to make more accurate selection decisions. With high costs of production and competition from other meats, cattle producers cannot tolerate mistakes in their breeding programs. Therefore, the ability to use sire summaries is important to the individual producer. Mistakes made on sire selection this year will show up in next year's calf crop. Three years later, the sire's genetic influence will become evident again as his daughters come into production.
Most breed associations now produce and distribute a sire summary. They are updated and printed annually. In most cases, they are free to commercial cattle producers. Requests for sire summaries should be made directly to the breed association's office. Traits that are economically important to most cattle producers are evaluated in these summaries. Most sires listed in the summary have been used in artificial insemination (AI) programs across several herds.
The traits listed vary slightly among breed sire summaries. They all evaluate the ability of a sire to transmit growth rate to his progeny in the areas of birth, weaning and yearling weights. Most breeds also evaluate the performance of daughters of the sire. This includes an evaluation of daughter calving ease and/or the ability of daughters to wean heavy calves (referred to as Maternal Breeding Value for weaning weight).
Sire evaluation in the beef industry has become a sophisticated procedure developed through experience, research, improved statistical procedures and the development of high-speed computers. Fortunately, a beef producer only needs to know a few basic concepts to interpret and use the results.
Terminology
Expected progeny difference (EPD)
Sire summaries use the term Expected Progeny Difference (EPD) to express the genetic transmitting ability of a sire. The EPD is reported as a plus or minus value in the unit in which the trait is measured, such as pounds for birth weight. An example of the Angus Sire Summary, which is similar to those of other breeds, is shown in Table 1. An EPD for yearling weight of +70.0 pounds indicates that progeny of this bull should average 70.0 pounds more at 365 days of age than progeny of an average bull of the breed. On the other hand, a bull with an EPD of -2.7 pounds for weaning weight would be expected to produce calves 2.7 pounds lighter at weaning weight than the average bull of that breed. Some breed associations express EPDs as ratios. When ratios are used, conversion factors are given so the ratios can be translated to EPD values. For example, the 1985 Simmental Sire Summary indicates that a one unit change in weaning weight ratio is equivalent to 5.27 pounds. Therefore, the EPD for weaning weight of a bull with a weaning weight ratio of 102.5 is equal to +13.18 pounds (5.27 pounds x 2.5).
EPDs are calculated from a sire's progeny data. All bulls listed in the sire summary can be directly compared using EPD values. EPDs are an estimate of how a bull's progeny would be expected to perform compared to any other bull listed in the same summary.
Studying Table 1, one would expect progeny of bull B to weigh 39.1 pounds more at weaning than progeny of an average Angus bull. One also would expect progeny of bull C to weigh 53.8 pounds more at weaning than progeny of an average Angus bull. Therefore, progeny of bull C should average 14.7 pounds (53.8 - 39.1) heavier at weaning than progeny of bull B. Likewise, progeny of bull B should weigh an average 41.8 pounds more at weaning than progeny of bull A.
Accuracy
An accuracy (ACC) figure is listed for each EPD as shown in Table 1. Accuracy is a measure of how much the EPD value might change as additional progeny data become available. Sires with more calves in several different herds will have higher accuracy figures. A high accuracy figure in Angus, Limousin, Polled Hereford and Hereford summaries indicates the EPD value will change very little as additional progeny data are collected. The accuracy figures shown in Table 1 indicate that the weaning weight EPD of bull A could change considerably more than the EPD for bull C. Low accuracy figures in Simmental and Gelbvieh summaries indicate greater accuracy. Therefore, select bulls to use based upon their EPD values and use the accuracy figure to determine how much to use a bull.
Table 1. Example of sire summary data from the 1984 Angus sire summary
| Evaluation report | |||||||||
|---|---|---|---|---|---|---|---|---|---|
| Birth weight | Weaning weight | Yearling weight | Maternal breeding value | ||||||
| EPD | ACC | EPD | ACC | EPD | ACC | EBV | ACC | DTS | |
| Bull A | -1.6 | 0.81 | -2.7 | 0.79 | -3.2 | 0.72 | 102 | 0.80 | 13 |
| Bull B | +2.4 | 0.90 | +39.1 | 0.91 | +70.0 | 0.83 | 103 | 0.76 | 11 |
| Bull C | +8.3 | 0.97 | +53.8 | 0.97 | +80.4 | 0.89 | 93 | 0.66 | 5 |
| Advantage for progeny weaning weights Bull B vs. Bull A + 41.8 pounds Bull C vs. Bull A + 56.5 pounds Bull C vs. Bull B + 14.7 pounds |
|||||||||
| ACC = accuracy DTS = number of daughters |
|||||||||
Maternal breeding value (MBV)
Although bulls do not wean calves, their daughters do. Therefore, producers are interested in whether a bull's daughters wean calves heavier or lighter than average. Much of the influence a cow has on the weaning weight of her calf is a result of her ability to milk. Maternal Breeding Value (MBV) describes how daughters of a bull are expected to produce compared to other cows in a herd. An estimated MBV can be calculated for an unproved bull using production data on daughters of his sire and paternal and maternal grandsires plus his dam's progeny. Once a bull's own daughters come into production, the MBV is calculated using the records of his own daughters in addition to those of his sire and paternal and maternal grandsires.
Estimates of MBVs come from pedigree analysis, not sire evaluation. Therefore, MBVs are not directly comparable between bulls as are the EPD values. Accuracy figures also are calculated differently. An accuracy figure of 0.95 for an EPD would indicate a high degree of accuracy, but a similar value for MBV is much less accurate.
Usefulness
Both commercial and seedstock producers should find sire summaries useful. A producer using AI can obtain semen from bulls that are superior in the traits of interest. This eliminates much of the guesswork that existed in sire selection prior to the advent of sire summaries. Thus, superior genetics are readily available to cattle producers who can use AI.
Producers who rely on natural service can use sire summaries to select bulls that are sons and/or grandsons of outstanding bulls in the summaries. Because a bull receives one-half of his genetic makeup from his sire, sons of bulls with superior EPDs are more likely to have superior breeding values themselves for the same traits. This is especially true if their individual performance records also are above average. Thus, summaries are particularly useful to commercial producers.
Summaries also can be used to identify herds that excel in genetic merit and vice versa. A breeder who has several superior bulls listed in the report is a more reliable source of bulls than either the breeder who has no bulls listed or the breeder who has poorer than average bulls listed in the summary.
Expanded usage
How might a breeder use sire summary data to effectively build a superior herd? This is done by stacking pedigrees or by simply using bulls in succession that excel in the same traits. In other words, breed the best to the best. For example, if you want to improve the breeding value for yearling weight in a herd, breed bulls with high yearling weight EPDs to daughters of bulls with high yearling weight EPDs.

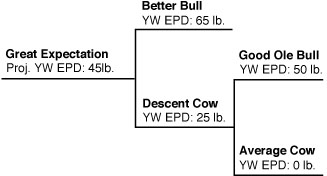
A pedigree for yearling weight has been stacked in Figure 1. Great Expectation is the calf that hopefully will be produced. His maternal granddam was Average Cow. She was bred to Good Ole Bull, who has a yearling weight EPD of +50.0 pounds This mating produced Decent Cow. Based upon principles of inheritance, the average calf from this mating would have a yearling weight EPD of +25.0 pounds [EPD of Decent Cow = 1/2 x (EPD of Good Ole Bull) + 1/2 x (EPD of Average Cow)]. Now, breeding Decent Cow to Better Bull produces Great Expectation. Better Bull has a yearling weight EPD of +65.0 pounds. This kind of mating would, on the average, be expected to produce calves that would have a yearling weight EPD of +45.0 pounds [45 pounds = 1/2 x 65 pounds (EPD of Better Bull) + 1/2 x 25 pounds (estimated EPD of Decent Cow)]. The EPD values of both the sire and dam have halved because they each contribute only one-half of their genetic makeup to their offspring.
If a large number of calves are produced from such a mating, one would expect them to have an average yearling weight EPD of +45.0 pounds There actually is a variation of EPD values. Some calves would have EPD values greater than +45.0 pounds and some would have EPD values less than +45.0 pounds. Based upon statistics, we know that for yearling weight nearly 68 percent of the calves would have EPD values from +30.0 to +60.0 pounds, 95 percent would have EPD values from +15.0 to +75.0 pounds and less than 2.5 percent would have EPD values in excess of +75.0 pounds. Stacking pedigrees offers a tremendous opportunity to build genetically superior cattle when breeders use sire summary data correctly.
How should producers use sire summaries for selecting young bulls? The projected EPD values for yearling weight calculated in the preceding paragraph for Great Expectation is an example of a pedigree index. When nothing is known about the calf except the EPD value of his sire and maternal grandsire, a pedigree index value can be calculated that becomes the best estimate of his genetic merit. Information on the production record of the dam and Great Expectation's own performance record also can be used to improve confidence in the evaluation of Great Expectation.
Assume Great Expectation's individual performance is superior and his dam also is superior in production. One would likely want to adjust the projected EPD values upward. The extent of adjustment depends upon how much above average Great Expectation's individual record and his dam's record are compared to the herd average.

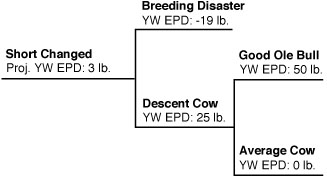
Figure 2 shows the effect of inappropriate sire selection on average breeding values in a herd. For example, take Decent Cow as in the previous sample and breed her to Breeding Disaster, who has a yearling weight EPD of -19.0 pounds. One would expect to produce progeny that would, on the average, have a yearling weight EPD of +3.0 pounds. Producers frequently make matings such as the one that produced Decent Cow. However, because their selection goals change, or another trait becomes more important to them, they often use bulls on these females that are below average in genetic merit for growth rate. For example, Breeding Disaster might have been a bull selected because of his type. When sire selection is not effective, progress can be slowed and even reversed.

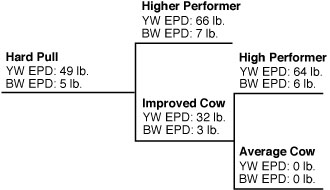
Selection for only one trait in a breeding program can be a problem because of undesirable genetic correlation. Therefore, "stacking pedigrees," using the principles of single trait selection, could cause some unwanted problems. For example, there is a positive genetic correlation between yearling weight and birth weight. This means that selection for yearling weight also will increase birth weight if no negative emphasis is placed on birth weight. Birth weight is highly related to calving difficulties. A producer whose only interest is producing high EPD values for yearling weight might also generate high EPD values for birth weight if he or she selects sires strictly on their yearling weight EPD values as illustrated in Figure 3.
The problem occurs because there is distribution of EPD values around the expected average. In Figure 3, the projected EPD for birth weight is 5.0 pounds, but 68 percent of the calves from this mating would be expected to have a birth weight EPD of +4.2 to +5.8 pounds and 95 percent would be expected to have a birth weight EPD of +3.4 to +6.6 pounds. Not only has a high EPD value been built up for yearling weight, but the same has also been done for birth weight.
Bulls with a combination of high EPDs for birth and yearling weights may be useful in terminal sire mating systems. Females placed with these bulls should be mature cows to minimize calving difficulties. It is questionable whether bulls with excessively high birth weight EPDs should be used to sire replacement females. Calving problems have resulted in increased death loss and calving intervals and lowered conception rates.
To continue genetic improvement in a herd, each new sire or group of sires should be superior to the last one used. In Table 1, bull A would be a better choice to breed to heifers than bull B or bull C because of his negative EPD value for birth weight. Bull B is probably the most useful bull in total merit because of his relatively high EPDs for weaning and yearling weights, his moderate EPD for birth weight and his above average MBV.
Summary
Accurate sire selection is important to the cow/calf producer. The effects of using a poor bull in a herd will be evident for several years. Sire summaries provide producers with accurate and reliable information on which to base selection decisions. These summaries, which use EPD values, give producers the opportunity to directly compare proven bulls with a high degree of accuracy. Bulls with low EPD values will sire some good calves, and the best bulls will sire some poor calves. However, the performance of a large group of calves by a sire should be similar to his EPD value. Sire summaries have taken much of the guesswork out of breeding beef cattle.
Adapted from a Beef Improvement Federation Fact Sheet prepared by Wayne Wagner, West Virginia State University; Jim Gibb, American Polled Hereford Association; Jack Farmer, California cattle breeder; and Daryl Strohbehn, Iowa State University. Reviewed by Al Smith, Virginia commercial producer; Darrell Wilkes, National Cattlemen's Association; Roger McCraw, North Carolina State University; Kenneth W. Ellis, University of California; Dixon D. Hubbard, Extension Service — USDA; Harvey Lemmon, Georgia Angus breeder; Robert D. Scarth, beef breeding consultant; and A. L. Eller, Virginia Polytechnic Institute and State University. Edited by Daryl Strohbehn and Gene Hettel, Iowa State University.